



 All Post
Publisher metrics that actually matter in 2026
Oct 22, 2026 | Author: Anna Battistella
Google traffic is shrinking. Here’s what to measure instead.
Reach, the UK's largest commercial news publisher, lost 55% of its Google referral traffic in the first half of 2026. Yet its revenue per thousand pageviews rose 49%, and its CEO announced the company is "moving away from volume". That is the state of publishing in 2026: pageviews and search traffic still matter, but on their own they no longer tell you whether your audience is growing, engaged or loyal.
In this article we look at what the latest industry research says about the metrics that really matter for publishers in 2026.
What’s changing in publisher traffic
For fifteen years, a publisher's scorecard was simple: more pageviews, more search traffic, more revenue. In 2026, each link in that chain is under pressure.
AI answers are reducing search clicks. Pew Research Center tracked the real browsing of 900 US adults. When Google showed an AI summary, users clicked a traditional result in 8% of visits, against 15% when there was no summary, and clicked a source inside the summary just 1% of the time.
Discover is no longer a safe harbour. Reach reported its Discover traffic down 46% in the second half of 2025, as Google pushed more video and user-generated content into the feed (Press Gazette).
The industry expects more of the same. In the Reuters Institute's Trends and Predictions 2026 survey, news leaders forecast search traffic to fall a further 43% within three years, as search engines turn into AI answer engines.
Readers are drifting to platforms. According to the Reuters Institute Digital News Report 2026, social media and video networks (54%) have overtaken publishers' own websites and apps (51%) as a way to access online news for the first time. Use of news sites and apps has fallen 12 points since 2020, while weekly use of AI chatbots for news rose from 7% to 10% in a year.
The same report notes that many publishers have stopped treating reach as their key success metric, prioritising depth of engagement with a smaller, more loyal audience. Reach is a case in point: fewer pageviews, but each one worth more, plus 40,000 digital subscribers in its first months behind a paywall.
The lesson for your analytics: volume metrics still pay the bills, but the metrics that predict your future are about where readers come from, how deeply they engage and how often they come back.
The 7 metrics that matter most for publishers in 2026
These seven metrics, read together, tell you whether your audience is growing, engaged and sustainable.
1. Pageviews (unsampled, or they don't count)
Despite what said before, pageviews are still the currency of ad-funded publishing: pageviews times RPM is your revenue. That is exactly why they must be exact. GA4 can sample large explorations and groups low-volume rows into "(other)", so the long tail of your archive is often estimated rather than counted.
In Publytics: every pageview is counted, with no sampling, thanks to the ZeroSample technology that handles up to 10 billion pageviews a month. Pageviews, Unique Pageviews, Sessions and Users are available for every page, in real time and historically.
2. Engaged time and scroll depth
Time is the metric serious newsrooms have moved toward. Mediahuis in Belgium uses aggregated attention time as its North Star, partly because it discourages clickbait (INMA). Mediahuis also found that the time individual readers spent on its sites correlated with how likely they were to subscribe and renew. The Financial Times went one step further with "Quality Reads": a pageview only counts if the reader spends at least half the estimated reading time and scrolls at least halfway down.
Traffic and attention are not the same thing. A curiosity-gap headline can win the click and lose the reader in seconds, and a pageview-only dashboard counts both outcomes as the same success.
In Publytics: Average time on page, engagement time and scroll depth sit next to pageviews in the same table, so you can rank articles by attention instead of clicks and spot the stories that get the click but lose the reader.
3. Loyalty: how often readers come back
Loyal readers are the audience publishers are now building around. The Reuters Institute Digital News Report 2026 finds that highly engaged "news lovers" have shrunk from 29% to 22% of the audience since 2021, but their usage, engagement and willingness to pay have held up: a smaller but durable market. As former FT strategist David Buttle argues, the strategic focus for almost every publisher should be direct relationships with loyal readers (Press Gazette).
In Publytics: track users, sessions and pages per session over time, watch the share of Direct and internal traffic, and use custom events to measure the actions that build habit, such as newsletter sign-ups or push opt-ins.
4. Traffic source mix, with Discover on its own line
When one channel can drop 40% in a year, the most important question is how dependent you are on it. You need Search, Discover, Direct, social, dark social and referrals as separate lines, not one "Google" bucket.
In Publytics: Google Discover is a source in its own right, in real time and historically, so you can see exactly which articles are trending on Discover and how much of your traffic depends on it.
5. AI referrals
AI traffic is small but it is the one discovery channel that is growing. Weekly use of AI chatbots for news rose from 7% to 10% in a year, and 16% among under-35s, and 42% of people who get news from chatbots say they always or often click through to the original source, between social media (36%) and search (44%) (Reuters Institute). Measure it now, while it is small, so you have a baseline when it matters.
In Publytics: a dedicated AI traffic report shows visits from the major assistants, such as ChatGPT and Gemini, each on its own line.
6. Recirculation: entrances, exits and internal traffic
Every reader you keep for a second article is one you do not have to win back from Google. This matters more as passive feeds grow: visitors from Discover rarely go on to a second page or come back to the site (Press Gazette). Good recirculation is how drive-by traffic becomes an audience.
In Publytics: Landing and Exit Pages reports show where readers enter and where they leave, so you can fix the pages that end sessions and strengthen the internal links on the ones that start them.
7. Real-time velocity
News moves in minutes. Knowing that an article is accelerating on Discover at 9:05, rather than tomorrow morning, is the difference between updating it, promoting it on social and pushing it to the homepage, or missing the moment.
In Publytics: Real-Time Trends show today's traffic minute by minute against yesterday or the same day last week. The Real-Time Overview lets you use any dimension as the primary one, including authors and categories, with a 24-hour mini trend on every row.
Other metrics you can see in Publytics
Knowing which metrics matter is half the job. The other half is having a tool that can actually show them. GA4 was built as a general-purpose, advertising-first platform; Publytics was built by publishers, for publishers. Here is what that means in practice.
Google Quality Raters visits
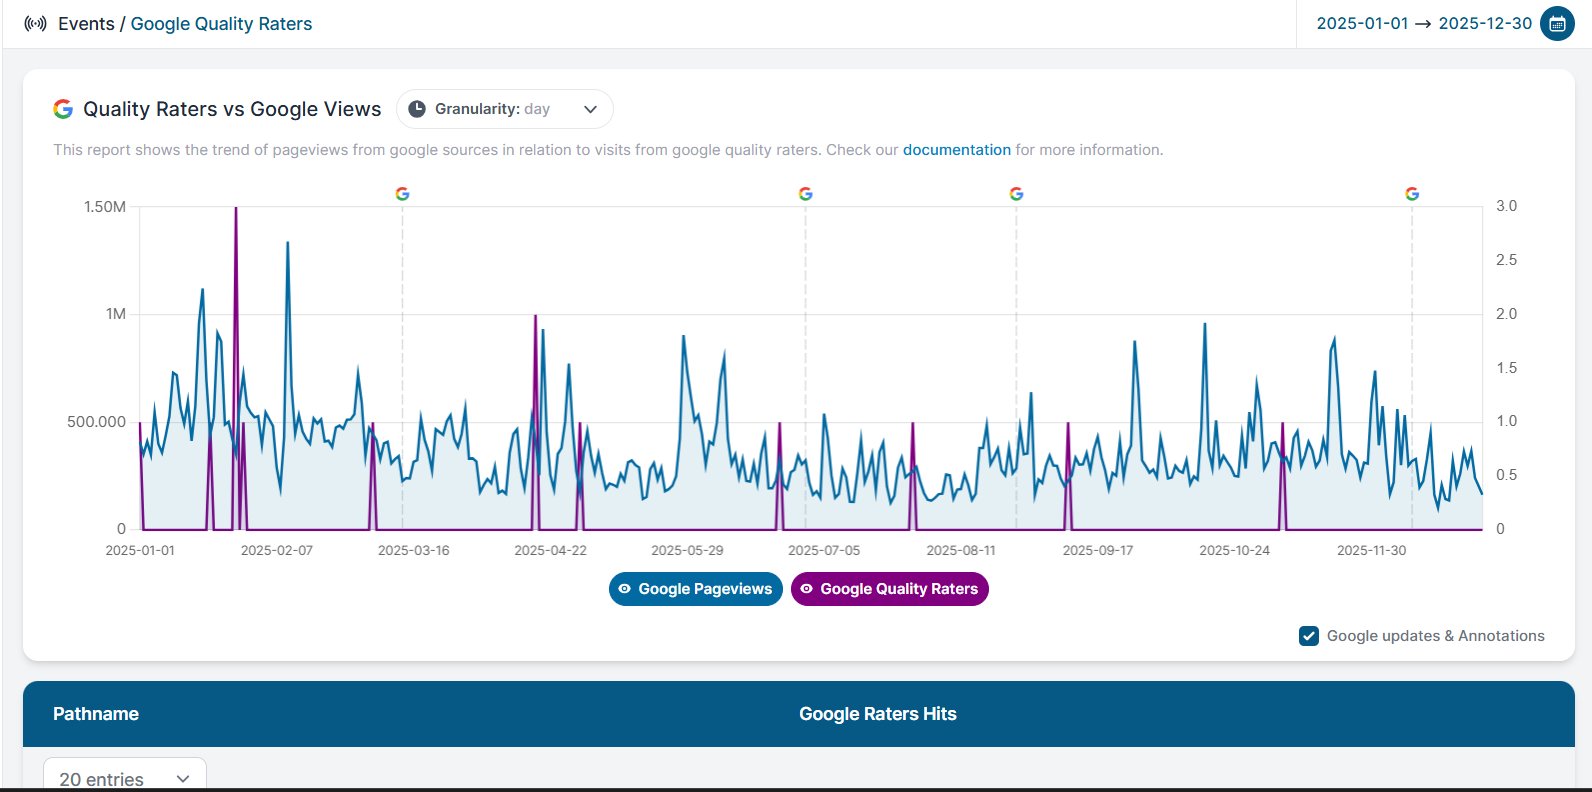
Google's roughly 16,000 Search Quality Raters review pages as part of evaluating changes to Search. Their visits are rare, often fewer than ten, and easily lost in sampled or thresholded data. Publytics detects them and collects them in a dedicated report (Events → Google Quality Raters) that plots rater hits against your Google pageviews and lists every page they opened.
In our recent case study, an Italian finance publisher recorded 14 rater visits after the May 2026 core update, 11 of them on a single day, shortly before losing more than 90% of its Google traffic. Instead of auditing thousands of pages, the team knew exactly where to start.
Google updates drawn on your charts
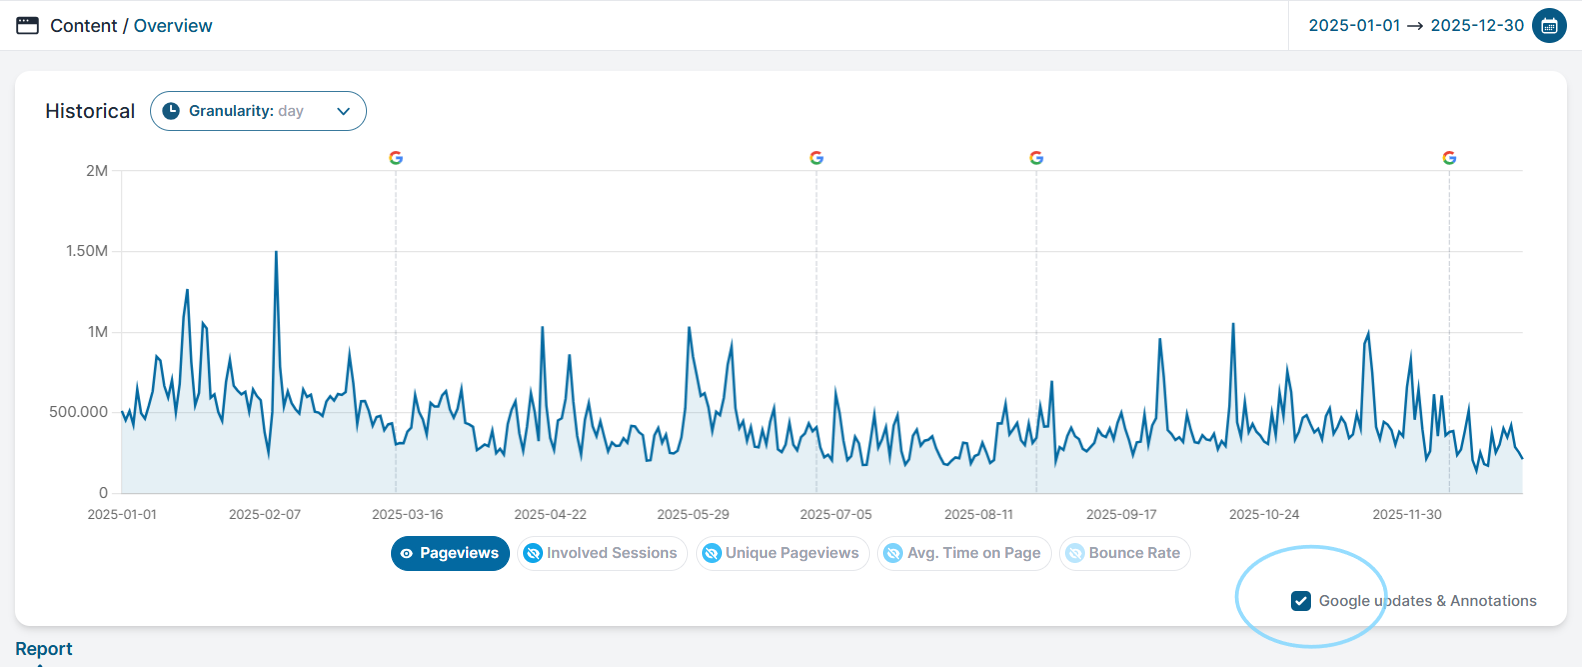
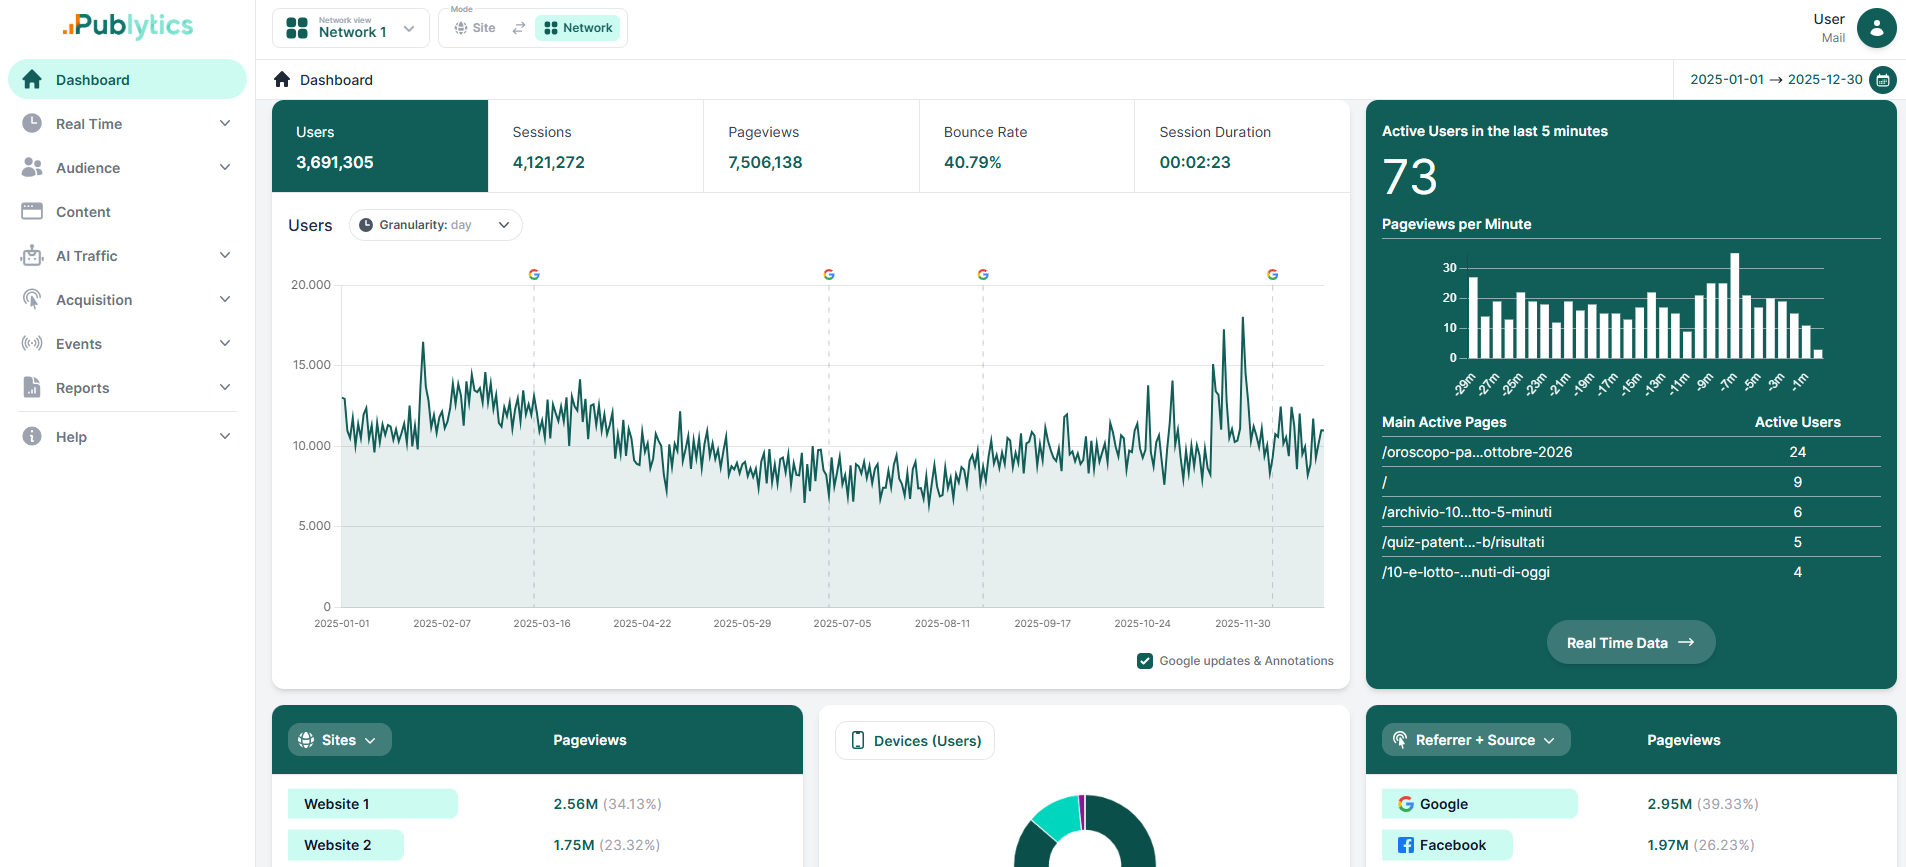
Every confirmed Google update is marked directly on your Publytics charts. When traffic drops, you see at a glance whether it lines up with a core update or a spam update, without cross-checking a separate timeline. Add your own annotations (a template change, a server migration) and every chart tells the full story.
Real time beyond the last 30 minutes, by author and category
GA4's Realtime report covers only the last 30 minutes, shows user-scoped dimensions and caps its cards at 700 rows, with the rest grouped as "(other)" (Google Analytics Help). For a newsroom publishing dozens of articles a day, that is a keyhole.
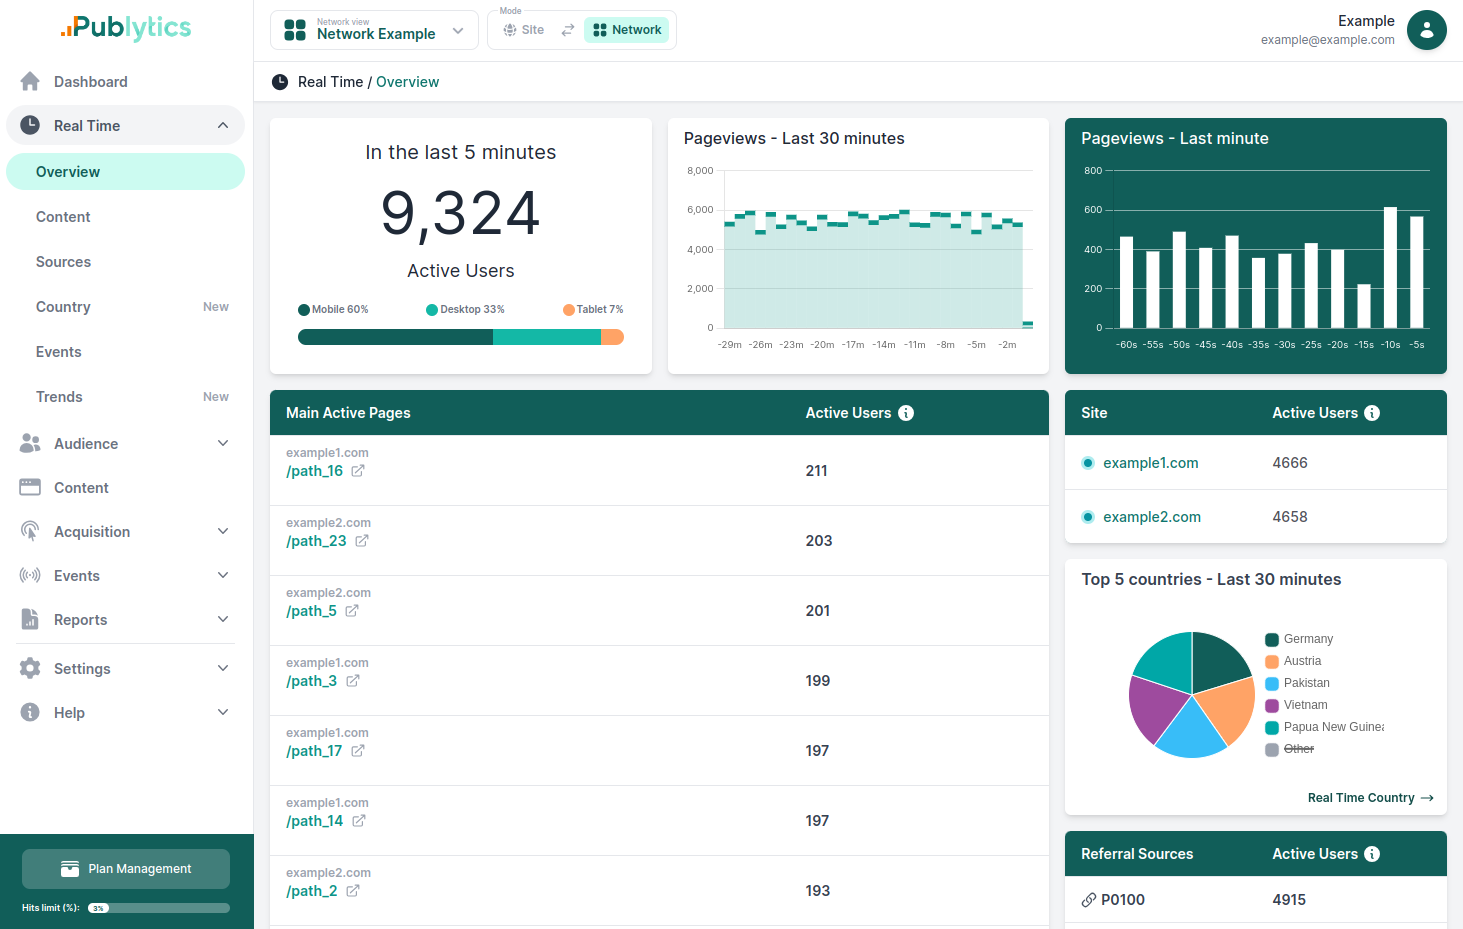
Publytics gives you the whole day, minute by minute, compared with yesterday or the same day last week and any custom dimension can be the primary one in the Real-Time Overview: open a live view of your authors or your categories, each row with its own 24-hour trend and today's total pageviews.
Your whole network in one live view
If you run several sites, the Network dashboard analyses all of them together, in real time and historically. Spot which property is driving today's traffic, compare sections across brands and find insights you would never see one site at a time.
Minute-level history
Historical charts in Publytics can be read by minute and by hour, not just by day. That is how you see the exact moment a push notification, a Discover pickup or a homepage change hit your traffic.
Complete data, not a modelled estimate
Publytics is cookieless and GDPR, CCPA and PECR compliant, with data hosted in Europe. Because there is no cookie to consent to, readers who reject the banner are still counted, anonymously. With no sampling and bots filtered out by default, the numbers you see are the numbers that happened.
Conclusion
Search and Discover are sending fewer clicks, and the publishers holding steady are the ones who know their audience in depth, not just in volume. Complete pageviews, real attention, loyalty, a diversified source mix and real-time speed: Publytics puts them all in one dashboard built for publishers.
See your own numbers in a few minutes.
No credit card required, and you can import your GA4 history so you never lose data.
Recent Posts
-
Publisher metrics that actually matter in 2026
Oct 22, 2026 | Author: Anna Battistella
-
Google Quality Raters: How to tell if they visited your site
Oct 12, 2026 | Author: Anna Battistella
-
HoneyLog now supports MCP: ask your AI assistant about your traffic
Sep 30, 2026 | Author: Anna Battistella
-
Google Discover Publisher Rankings in August 2026: winners, losers, and major shifts
Sep 17, 2026 | Author: Anna Battistella
-
Google Discover Publisher Rankings in July 2026: winners, losers, and major shifts
Aug 24, 2026 | Author: Anna Battistella
Start monitoring your websites in few seconds No credit card required!
Start monitoring your websites in few seconds