

Why Your Multi-Sites Deserve a Unified Dashboard
Feb 26, 2025 | Author: Bruno Cazzaniga
The Publisher's Guide to Multi-Site Analysis
In today's digital publishing landscape, managing a single website is already challenging. But when your business grows to include a network of 5, 10, or more websites, the complexity increases exponentially. Many medium-sized publishers find themselves navigating between different analytics platforms, trying to build a coherent overview of their digital ecosystem.
The Hidden Challenge for Publishers with Multi-Sites (Roll-ups)
If you own or manage multiple websites, you probably recognize this scenario: you open several browser tabs, switch from one analytics account to another, export data to spreadsheets, and manually try to aggregate metrics from different sources. This approach is not only inefficient—it's also risky for your business.
When data is fragmented, you lose the complete view of your audience and your network's performance. It's like trying to assemble a puzzle with pieces from different boxes: the final image will be incomplete or distorted.
The Real Value of an Aggregated View
A unified dashboard for your multi-sites isn't just a convenience tool—it's a powerful business accelerator. Here's why:
1. Understanding Traffic Distribution
Knowing exactly how traffic is distributed across your sites allows you to immediately identify which sites are performing better and why, recognize seasonal trends that influence the entire network, and detect anomalies that might remain hidden when analyzing sites separately. This comprehensive view transforms isolated data points into actionable intelligence for your publishing strategy.
Practical example: A publisher with five local news sites discovered, thanks to aggregated analysis, that one of its sites received 40% of the network's total traffic but generated only 15% of the revenue. This led to a review of the monetization strategy specific to that site.
2. Author Analysis Across the Multi-Site
If you have authors contributing to multiple sites in your network, an aggregated view is essential to identify which authors generate the most overall engagement, optimize author allocation across different sites, and recognize themes and topics that perform better regardless of the publication site. This holistic perspective enables smarter content planning and more effective talent utilization across your entire publishing ecosystem.
Practical example: A network of sports sites discovered that articles by a particular journalist generated twice the time on page compared to the average, regardless of the site where they were published. This led to a more targeted content strategy.
3. Identification of Shared Audience Patterns
Aggregated analysis reveals valuable insights, including audience overlaps between your sites that can guide cross-promotion strategies, a deeper understanding of navigation behaviors as users move across different sites, and the identification of monetization opportunities by leveraging shared audience interests.
Practical example: A publisher with sites dedicated to technology, gaming, and cinema discovered that 30% of readers regularly navigated between all three sites. This led to the creation of cross-site advertising packages that increased revenue by 25%.
4. Resource and Budget Optimization
An overview enables you to allocate editorial resources where they generate the greatest impact, optimize your advertising budget by evaluating the performance of the entire network, and make strategic decisions based on comprehensive, not partial, data.
How to Implement Effective Aggregated Analysis
Implementing effective analysis of the entire network requires a structured approach:
1. Data Centralization: The first step is to collect all analytics data in a single platform that supports multi-site viewing.
2. Standardized Metrics Definition: Ensure all sites use the same measurement conventions to ensure comparability.
3. Custom Dashboard Creation: Develop visualizations that highlight the most relevant metrics for your business model.
4. Regular Comparative Analysis: Establish a process for periodic review of aggregate performance.
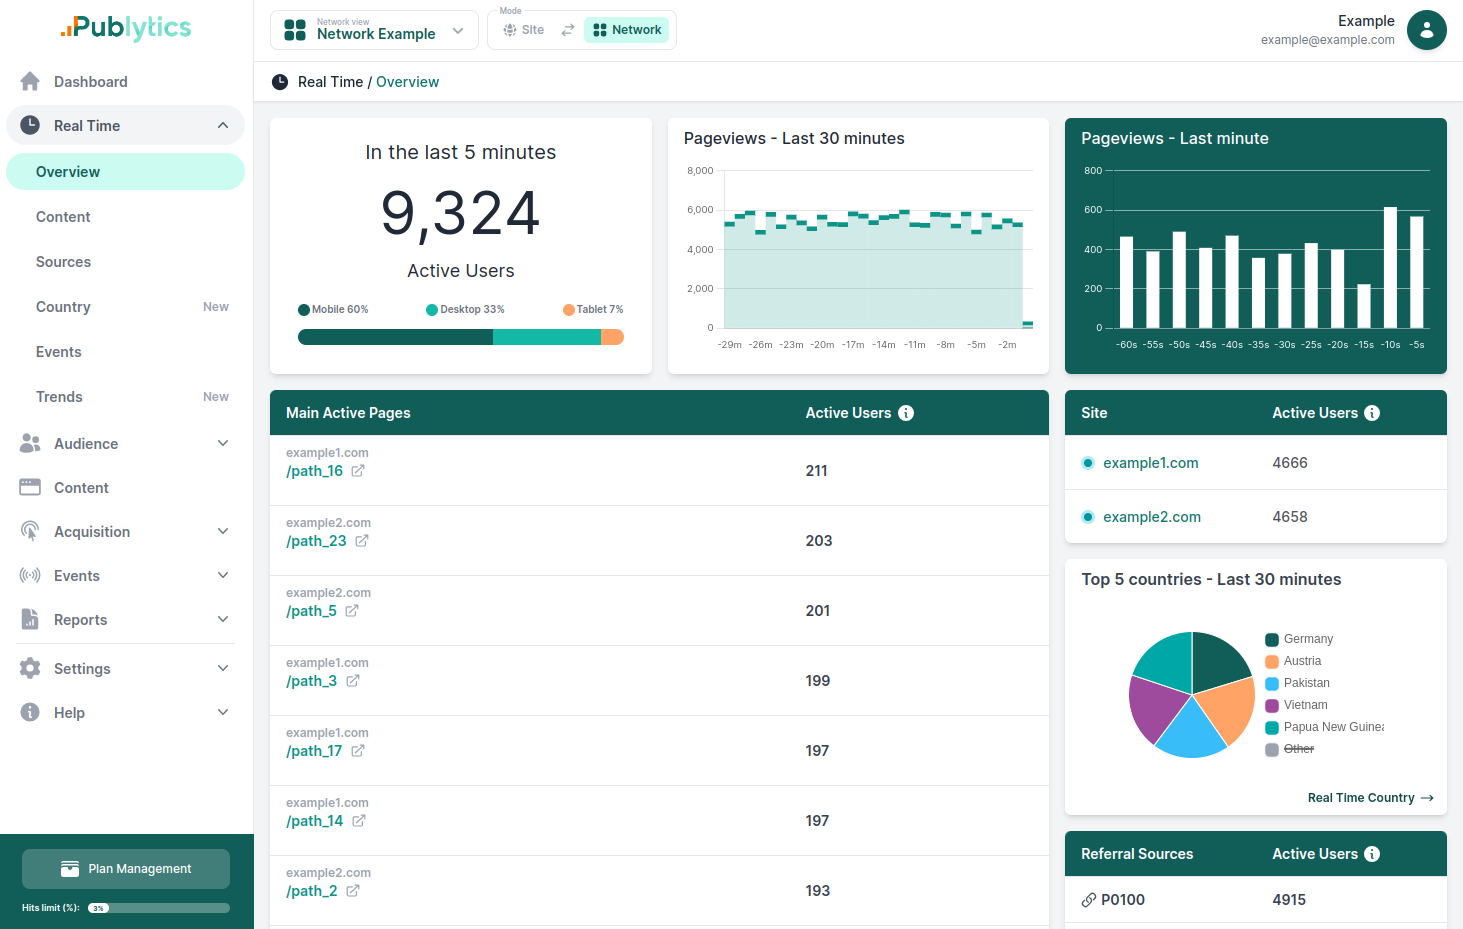
The Publytics Solution: Simplifying Complexity
Publytics has been specifically designed to address this challenge, offering a powerful Network functionality that allows you to switch from viewing a single site to the entire multi-site network with a simple toggle. In the Publytics dashboard you can create custom groups of sites view aggregated data (up to three different networks with the Business subscription and unlimited with Enterprise) while retaining the ability to filter by individual site.
You can also generate comprehensive reports for the entire network or specific subgroups of sites.
Implementing Publytics for your network analysis is simple: just activate the "Site → Network" switch and create a new network via "Add Network." Once configured, you can perform all the analyses you already do for individual sites, but with an overview of the entire ecosystem.
Conclusion: The Competitive Advantage of Seeing the Whole Picture
In an increasingly competitive publishing market, the difference between success and failure often lies in the quality of strategic decisions. And the best decisions are always based on complete and accurate data.
If you're still analyzing your websites one by one, you're operating with a partial view that could cost you significant growth opportunities. Investing in a solution like Publytics isn't simply an operational optimization—it's a competitive advantage that allows you to see trends and opportunities that your competitors, still fragmented between different analysis tools, cannot grasp.
It's time to unify your vision and unlock the true potential of your website network. Try Publytics for free for 14 days and collect multi-site insight in minutes.
Recent Posts
-
Case Study: How LiveSicilia gained granular, real-time traffic clarity with Publytics
May 25, 2026 | Author: Anna Battistella
-
Google Discover Publisher Rankings in April 2026: winners, losers, and major shifts
May 18, 2026 | Author: Anna Battistella
-
Google launches "Preferred Sources" worldwide: what changes for SEO and Publishers
Apr 30, 2026 | Author: Anna Battistella
-
Case Study: How Money.it eliminated data sampling and sped up editorial decisions by switching to Publytics
Apr 27, 2026 | Author: Anna Battistella
-
Google Discover Publisher Rankings in March 2026: winners, losers, and major shifts
Apr 23, 2026 | Author: Anna Battistella
Start monitoring your websites in few seconds No credit card required!
Start monitoring your websites in few seconds