
Dashboard
The first thing that you will see once registered is the Dashboard. This page was ideated to group the most relevant data in a single place so that as soon you open publytics you can understand in a few seconds your website's most important analytics. You have different panels in this dashboard:
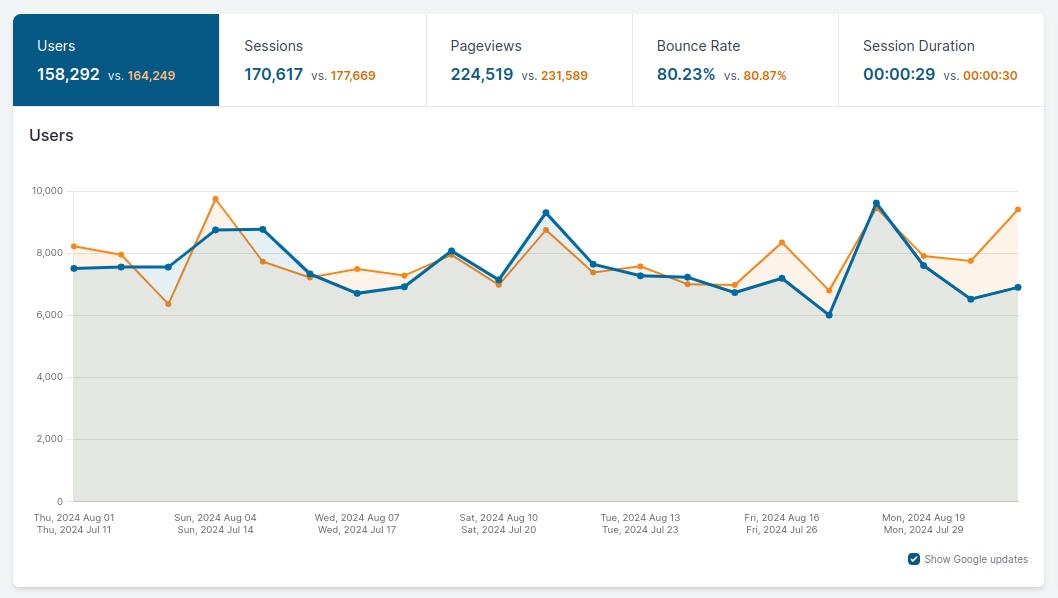
Site Preview
Helps you to monitor different metrics that you can select: Users, Sessions, Bounce Rate and Session Duration. With the help of the calendar on the top of the screen you will be able to compare the numbers with previous periods or even to select larger windows of time.
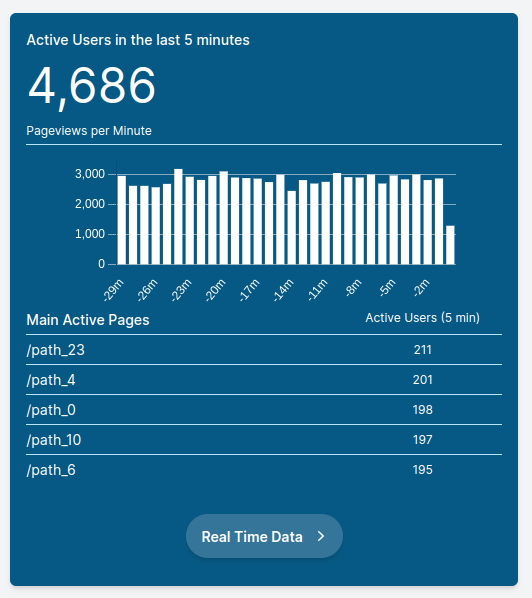
Last Minute Users
Shows you the number of active users in the last 5 minutes, a chart of the number of active users in the last 30 minutes and some of the most viewed pages in real time. To get deep into real time analytics just click on the button below to go to Real Time.
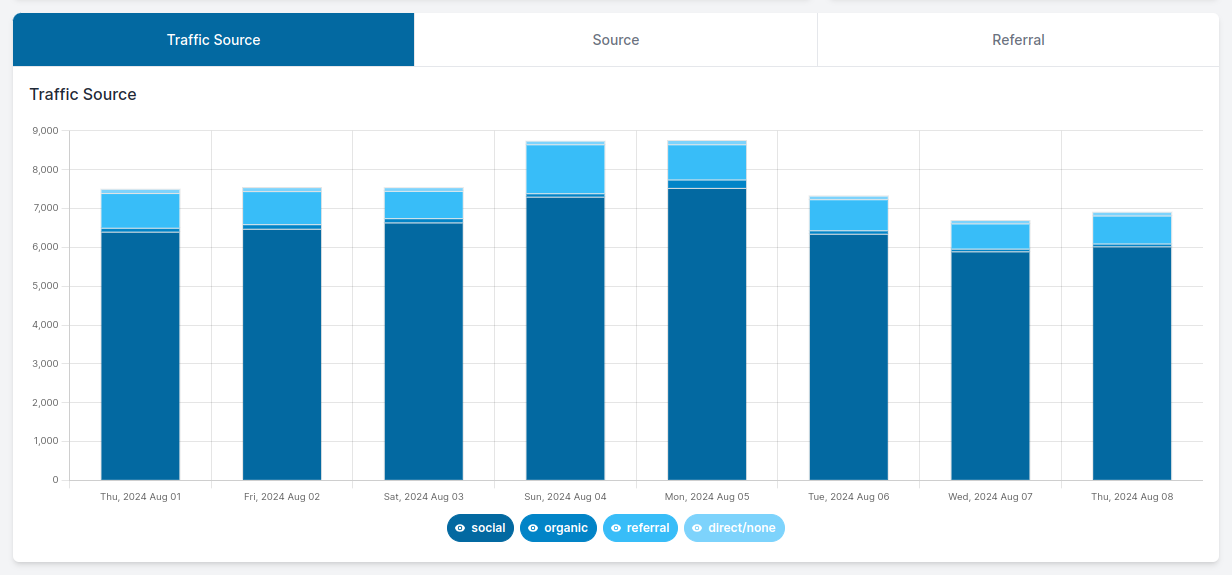
Traffic source
Is a simple panel that helps you monitor Sources and Referrals .
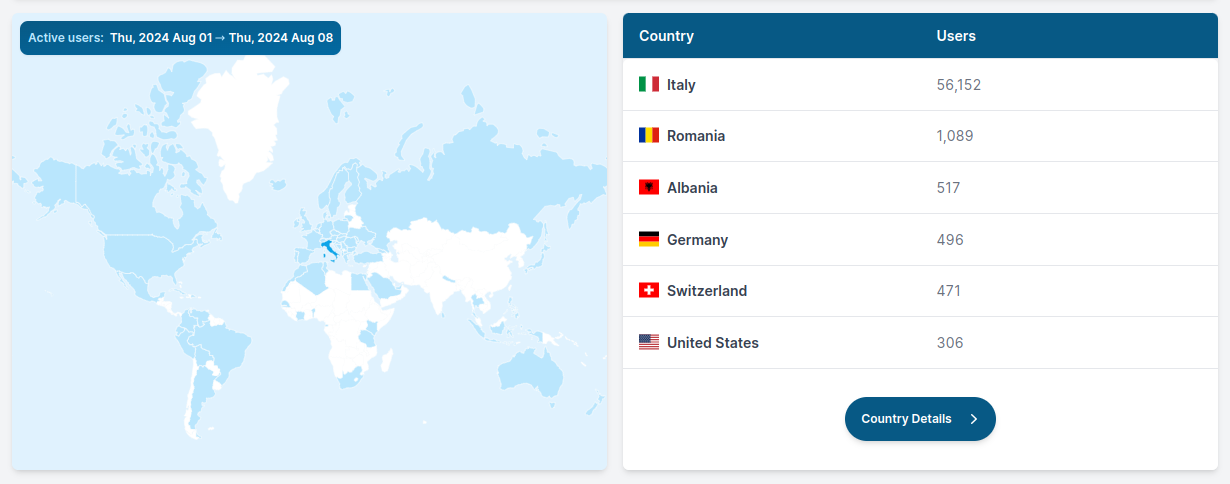
Map
Shows you the list of countries in which your site is being visited and an interactive map where you can see directly the countries that bring more traffic to your website. If you click on the Country details button you will be redirected in the Audience section
where you will have a more detailed analysis of your audience.