



Charts
Publytics charts are designed to make your analysis fast and simple, showing you all the metrics you need.
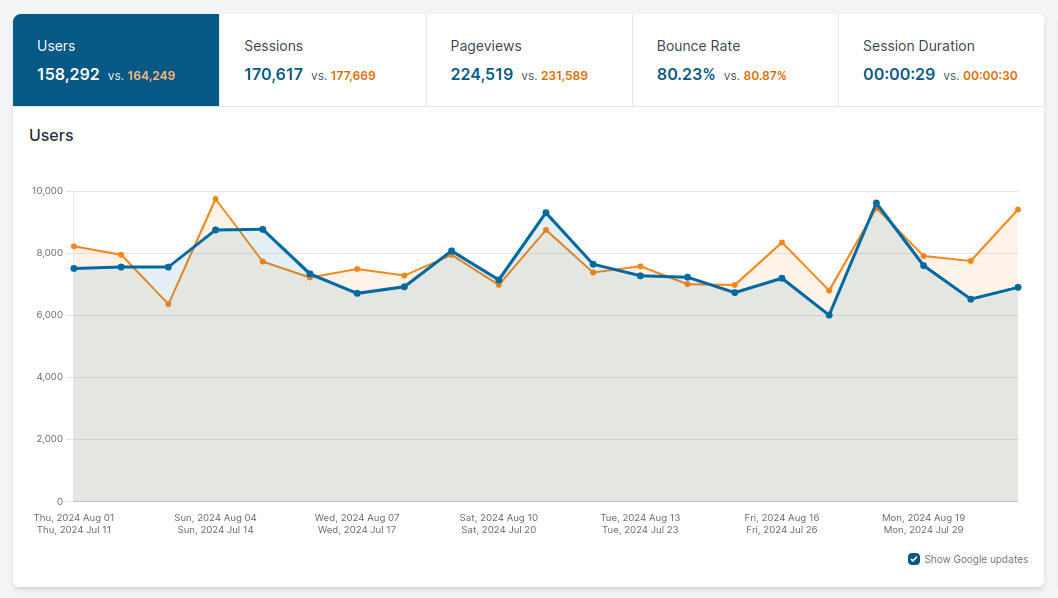
You can easily edit every chart time range with the Date picker on the top right corner of the page to have a complete view of the analytics of your site.
In some sections you can see some buttons right below the main chart. This buttons can be selected or deselected depending on what metrics you want to analyze. Obviously you can also see multiple lines representing different metrics at the same time on one chart.

Another important tool you can see in our charts is the google update toggle button which allows you to see the if a google update occurred in the period under analysis. It is a simple yet important tool that makes you understand if the latest google update has rewarded or punished your website.
Lines or bars
The charts above the report tables (Content, Entry and Exit pages, Acquisition, Events and your custom reports) have a Line / Bars switch next to the granularity selector. Bars make it easier to compare single days, weeks or months; lines show the trend. Your choice stays selected as you move to the other pages.
Plot table rows on the chart
On the same pages you can draw rows of the table on the chart, to compare them over time: for example three articles, or Google against Facebook.
- Tick the box at the start of a row. Each ticked row becomes a line (or a series of bars) of its own color, up to 5 rows at once.
- Choose, next to "by" above the chart, the metric the rows are drawn by, among the metrics of the table.
- Click Show totals to go back to the chart of the whole table: the rows are unticked.
A plotted row keeps following the date range and the filters of the table. Changing the dimensions of the table changes what a row is, so it unticks them all. While rows are plotted the comparison period is not drawn.