

What is a metric?
A metric in Publytics is any variable on which numerical calculations can be performed. Publytics already provides for the presence of the most common metrics for all sites such as Pageviews, Sessions, Bounce Rate, Avg. Time on Page and many others. Those just described are referred to as Standard Metrics and are common to all sites.
What is a custom metric?
In some cases, however, it is necessary to specify the presence of custom metrics that may vary depending on the type of site. In fact, some sites may be interested in pushing additional (custom) metrics such as Revenues, Percentages, Numbers or Seconds. This is why Publytics provides everyone with the ability to use custom metrics to ensure maximum customization in data analysis.
Unlike dimensions, metrics must necessarily be numbers as they can be subjects of numerical analysis.
How to set a custom metric
To set a custom metric you have to visit the section Settings > Custom Metrics where you can manage your custom metrics and create new ones. Once you click on the button Add custom metric you will see this popup:
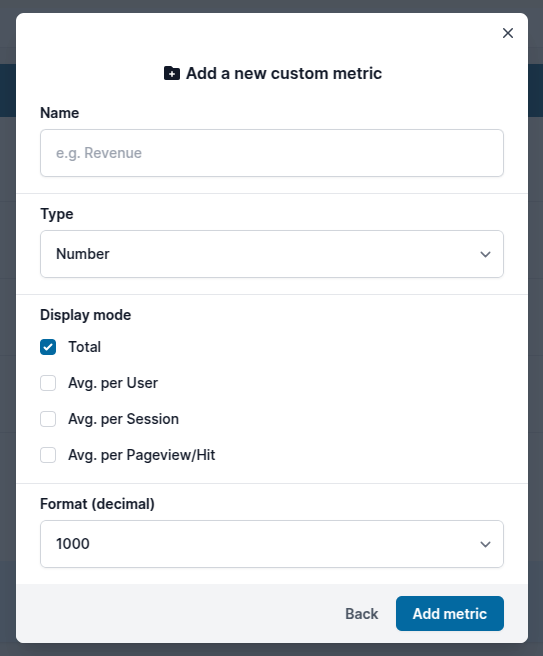
Publytics allows the addition of 4 different types of custom metrics:
-
Number: Generic type that allows the insertion of any integer
-
Percentage: Any percentage value associated with an event (such as scroll depth or bounce rate for example)
-
Revenue: Any Integer or decimal value representing a revenue. For this type you can also associate it with a currency (such as dollora, euro etc.)
-
Seconds: Any integer or decimal representing an amount of time (in seconds)
For each type of custom metric, except for the percentage type, it is necessary to choose on what data to calculate averages to be shown later in the tables thanks to checkboxes when creating the metric. Yopu can choose from 1 to 4 options given:
-
Total
-
Avg. per User
-
Avg. per Session
-
Avg. per Pageview/Hit
This is necessary to show data of your custom metrics on Publytics table.
For example if your custom metric is a specific revenue, You may want to know the average revenue per User on your table or the Average revenue for sessions (or both). While if your custom metric represents for example the scroll Depth reach (percentage) you may want to know the Avere scroll depth reached for each Pageview.
At the end of the for you can also choose if you want to visualize your metric as an integer or a decimal number.
If you want to push decimal value remember to push it multiplied by 100. For example if you need to push ne number 99,99 you must push 99,99 * 100 = 9999.
Every metric pushed must be an integer, the decimal options only affect the way it will be elaborated.